How AURORA Works
AURORA automates stock analysis using structured prompts and web crawlers. Follow this step-by-step visual onboarding guide to leverage our research workspace.
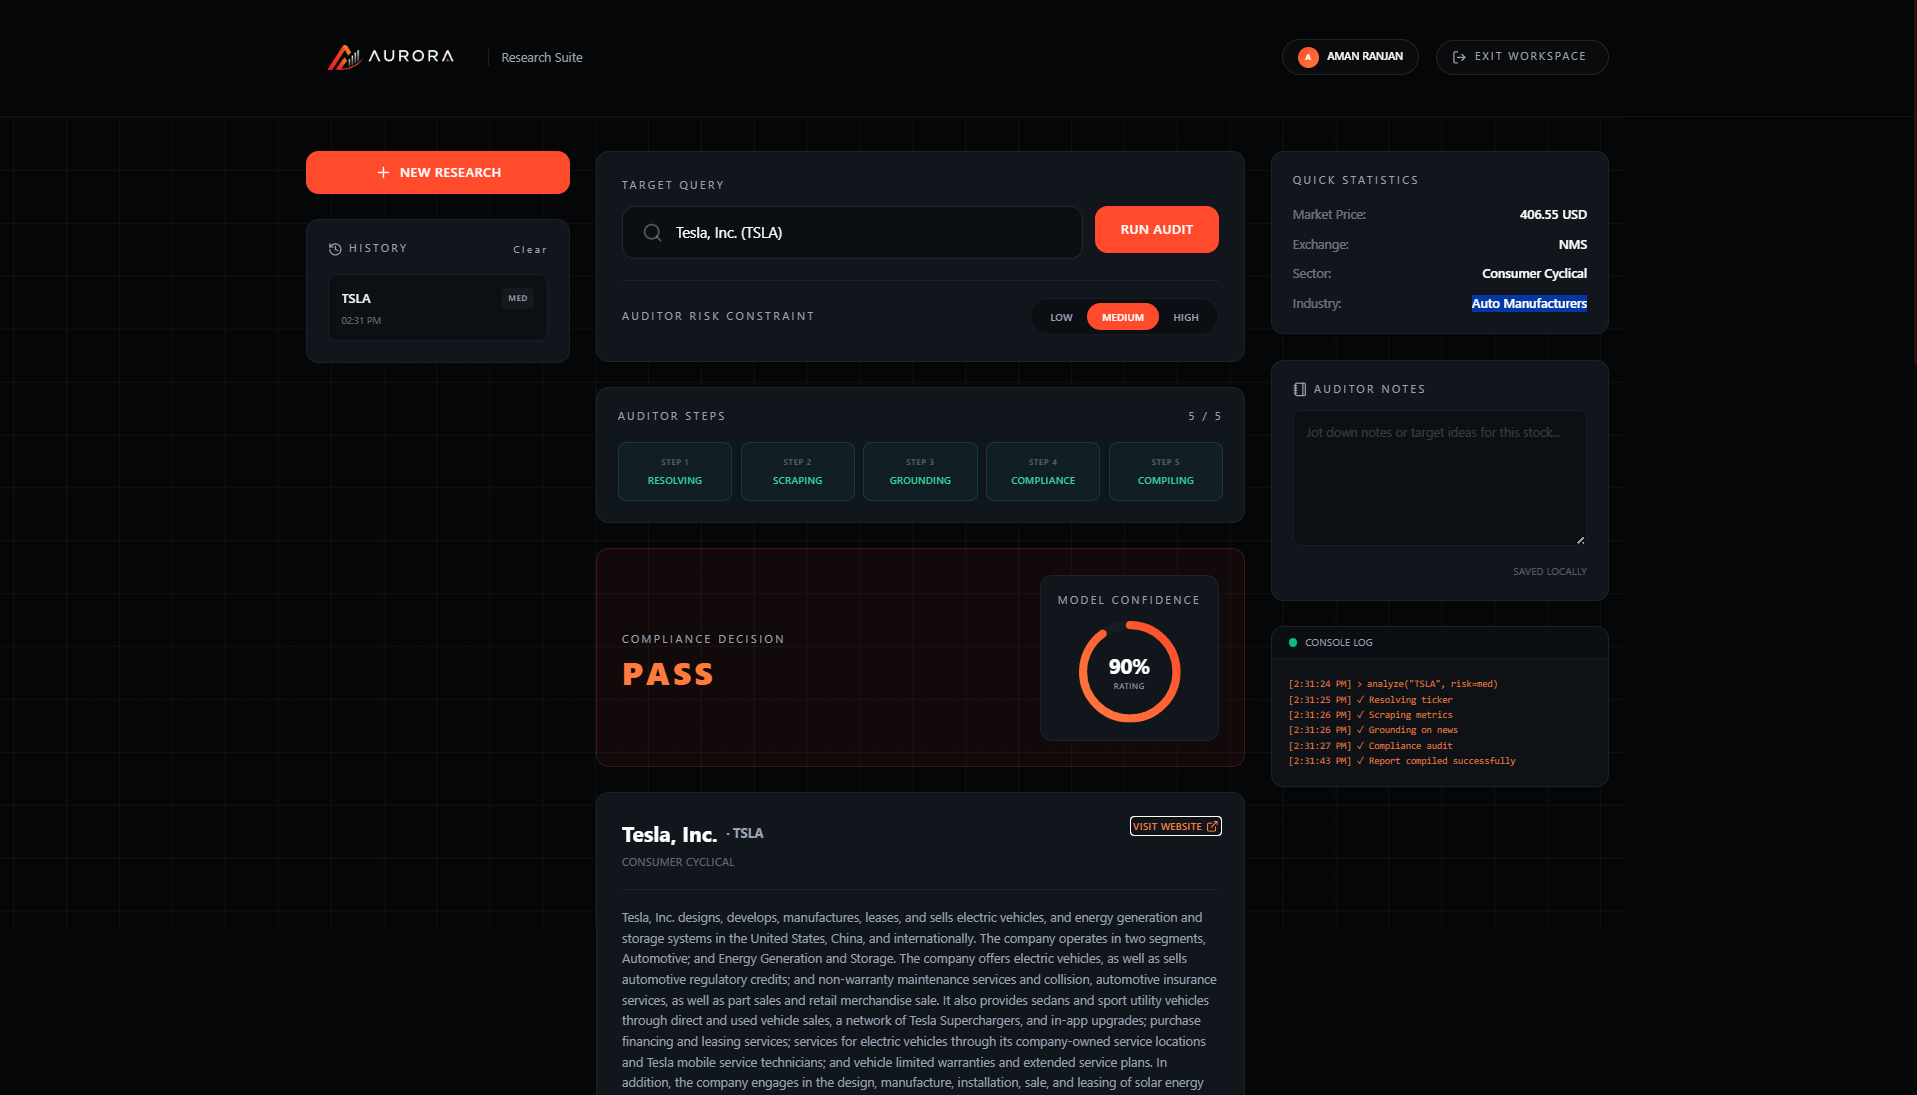
1. Search Company or Ticker
Type a company name (e.g. 'Apple', 'Tesla') or stock symbol in the search input box. The autocomplete engine searches listing options character-by-character.
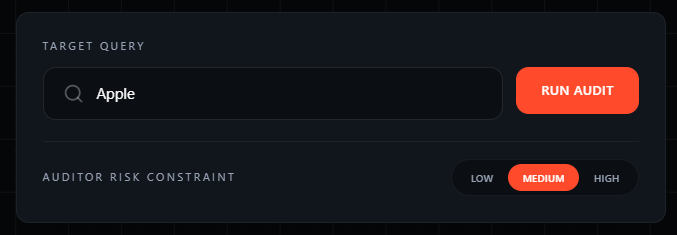
2. Select from Suggestion Dropdown
Select the correct stock listing from the suggestion dropdown menu to lock in the ticker (e.g. AAPL, TSLA) and run the audit.
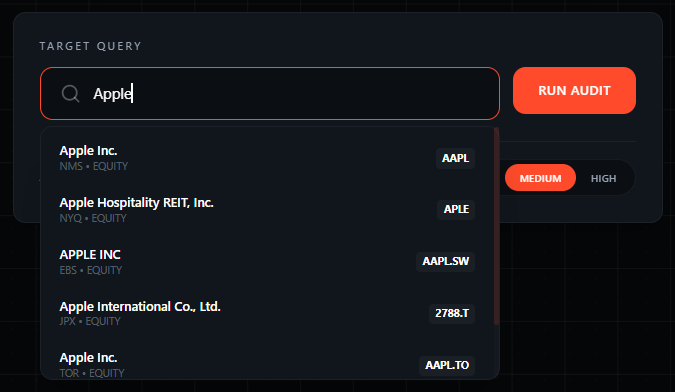
3. Monitor Live Pipeline Stepper
Watch the active workflow progress bar. Five key auditing steps run sequentially: Ticker Resolution, Financial Fetching, News Scraping, AI Analysis, and Compilation.

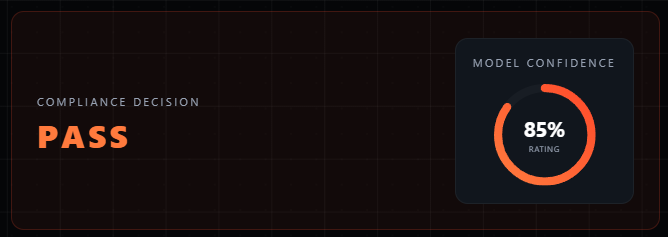
4. Review Compliance Decision
Check the top compliance block. AURORA displays a final rating ('INVEST' in green or 'PASS' in red/orange) alongside a circular SVG confidence gauge.
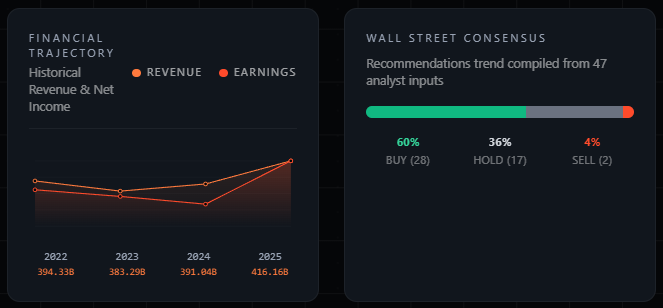
5. Financial Trajectory & Analyst Consensus
Analyze interactive charts. The Historical Earnings line graph renders 4 years of annual Revenue and Net Income trends. Wall Street Consensus aggregates buy/hold/sell trends.
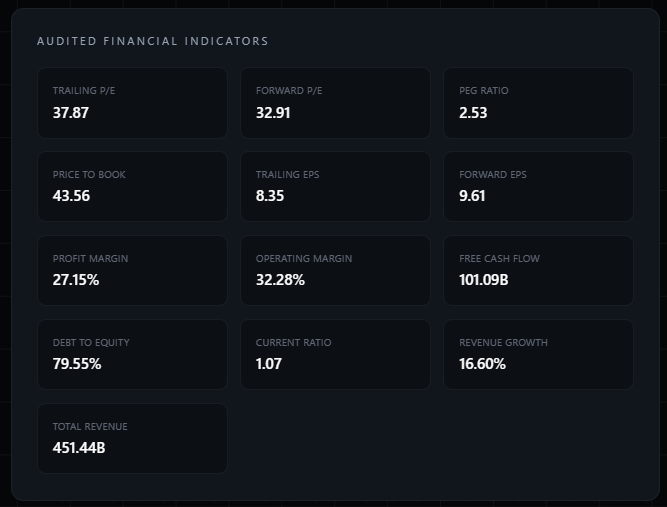
6. Audited Financial Indicators
Examine the 9-indicator metrics grid. Displays critical key statistics like current P/E ratio, forward P/E, PEG, Price-to-Book, profitability ratios, margins, current liquid ratios, and total leverage.
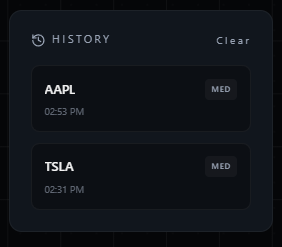
7. Manage Query History
Re-hydrate previous audits instantly. The left sidebar stores past query logs. You can sync history profiles to the cloud database or clear them with a single click.
Frequently Asked Questions
Q: Why do some searches return "No historical trends retrieved"?
A: Some tickers (especially international listings) do not publish yearly financials on public endpoints. The UI will render fallback indicators gracefully so the main analysis is still readable.
Q: How do the Risk Tolerances (Low, Med, High) affect verdicts?
A: Low tolerance triggers strict solvency rules (e.g. rejecting high Debt-to-Equity companies). Med and High tolerances loosen criteria, allowing Gemini to focus on earnings growth potential.